The Reports page answers the questions every contractor asks: How much did I bring in? How many of my estimates are turning into work? Who still owes me money? It pulls those numbers straight from your estimates, invoices, and recorded payments — there's nothing to set up.
Opening your reports
From your Dashboard, open Reports — it's in the top navigation menu, and there's also a Reports tile on the dashboard. Everything on the page is read-only, so you can't change any of your data from here.
Choosing a date range
Use the date-range selector at the top right to switch between This month, Last month, Last 90 days, This year, and Last year. The summary cards and the close-rate figures update to match the range you pick. (The revenue chart always shows the last 12 months, and aged receivables are always shown as of today — more on both below.)

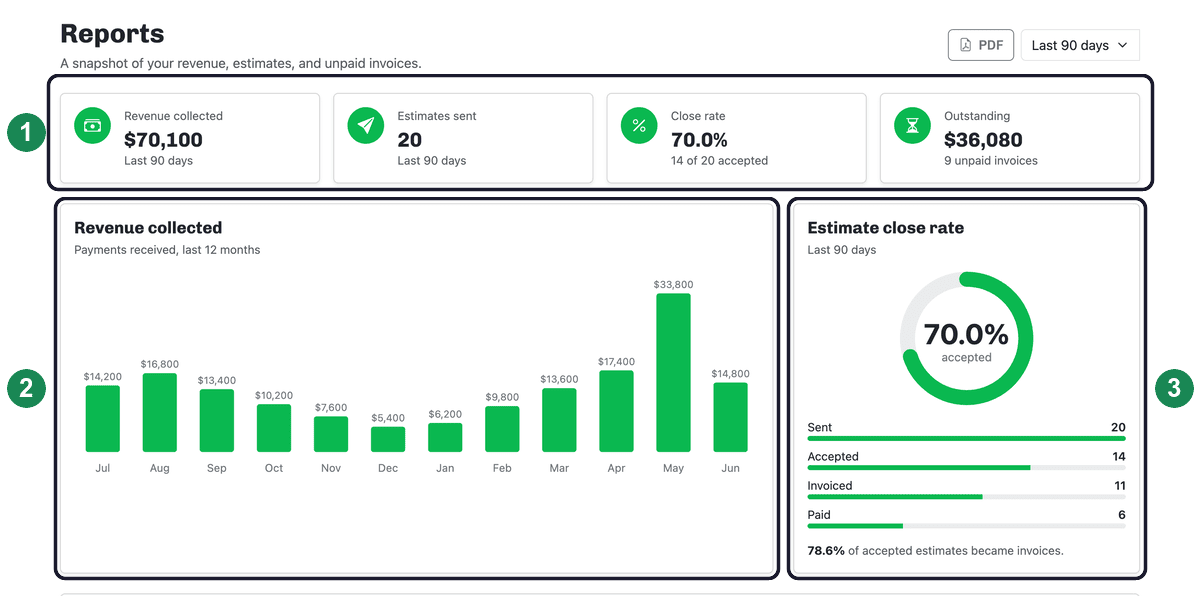
The summary cards
- Revenue collected — the total of the payments you recorded in the selected range.
- Estimates sent — how many estimates you created in the range.
- Close rate — the share of those estimates that have been accepted.
- Outstanding — the total still owed across your unpaid invoices, as of today.
Revenue collected
This chart shows the payments you've recorded, month by month, for the last 12 months. It's based on money actually received — that is, the payments you record against an invoice — not on the value of estimates or invoices you've sent.
Estimate close rate
The close-rate dial shows the percentage of estimates created in your selected range that have been accepted. Below it, a short funnel breaks the same estimates down by stage — Sent, Accepted, Invoiced, and Paid — so you can see where jobs drop off. Just under the funnel, a conversion line shows what share of your accepted estimates went on to become invoices. For what each stage means, see Estimate statuses.
Estimates you created very recently may not be accepted yet, so a short date range can show a lower close rate than a longer one — that's expected.
Top customers by revenue
This card ranks the customers who've paid you the most in the selected date range, with a bar for each so you can see at a glance where your revenue is concentrated. Like the revenue chart, it's based on payments you've recorded, so keep payments up to date for an accurate picture.
Aged receivables
This is your "who owes me money" list. Every invoice with a remaining balance is grouped by how long it's been outstanding: Current (0–30 days), 31–60 days, 61–90 days, and 90+ days. The colored bar shows how your outstanding balance splits across those buckets, and the table lists each unpaid invoice — newest-overdue at the bottom, oldest at the top — with the customer, its age, and the amount still due. Click an invoice number to open it and record a payment.
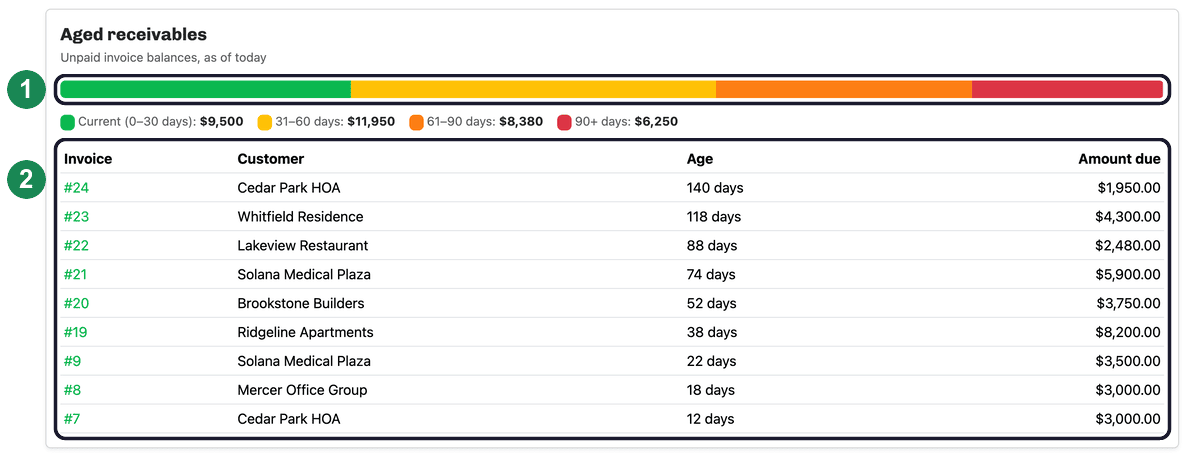
An invoice's balance is its total minus the payments you've recorded against it, so as soon as you record a payment the amount due here goes down (and disappears once it's paid in full).
Download a PDF
Click PDF at the top of the page to download a printable copy of the report for the range you're viewing — handy for sharing with a partner or bringing to the bank. The PDF includes the same summary numbers, revenue chart, close rate, top customers, and aged-receivables breakdown.